You run an HVAC company. It's Sunday night, and you want to know how the week went. So you call your office manager. Or you log into ServiceTitan, then QuickBooks, then maybe a spreadsheet your dispatcher keeps. By the time you piece together the full picture, it's Monday morning and you're already behind.
This is the part of running an HVAC business that nobody talks about. The work itself is fine. Your techs know what they're doing. But the business side, the revenue tracking, the technician performance, the maintenance plan renewals, it's scattered across four or five systems that don't talk to each other.
A custom AI dashboard fills that gap. Not another piece of software to learn. A single screen that pulls everything together and tells you what's happening without making you dig for it.
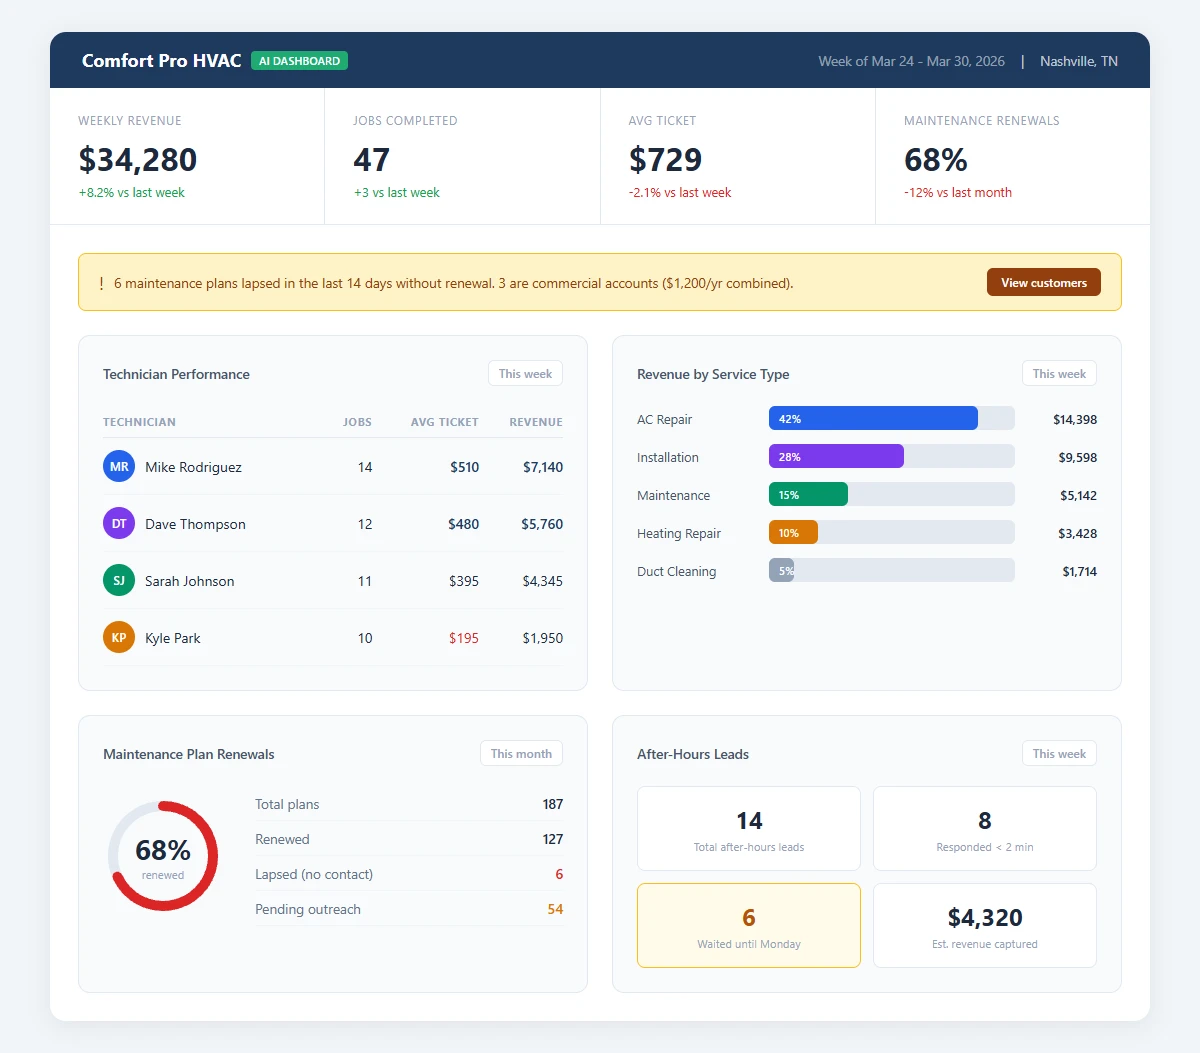
A mockup of the Service Call Revenue Tracker we'd build for an HVAC company, showing real-time job tracking, technician performance, and revenue by service type. The numbers are fictional, but the layout and metrics are based on what HVAC companies tell us they need. Download as PDF
View interactive version
What an HVAC business dashboard tracks
Think of it as a control room for your company. You open it on your phone or laptop, and within seconds you can see the numbers that drive your week.
Revenue by technician is the first view most owners want. Not just totals, but average ticket size, calls completed, and close rate on upsells. If one tech is averaging $480 per call and another is at $220, you know who needs ride-alongs and who deserves a Saturday off.
Revenue by service type is the second. AC repair, heating installs, maintenance visits, duct cleaning, each broken out with margins. You might discover that drain cleaning calls barely break even after drive time, but your installation revenue is quietly carrying the business. That changes how you schedule and where you put your ad spend.
Then there's maintenance plan renewal rate. This is the number most HVAC companies lose track of entirely. You sold 200 plans last year, but how many renewed? The dashboard shows which customers lapsed and when, and flags the ones who haven't rebooked. Your team can follow up before those customers forget you exist.
The last piece is after-hours lead volume. About 55% of HVAC inquiries come outside business hours. The dashboard tracks how many after-hours leads came in, how quickly they got a response, and whether they converted to a booked job. If you're losing leads at 9 PM on a Tuesday, you'll see it. (If you want to fix that problem too, AI-powered lead follow-up can respond to those leads automatically while you sleep.)
The Sunday night scenario
You're reviewing the week on Sunday night. Instead of calling your office manager, you open the dashboard on your phone.
First thing you notice: maintenance plan renewals are down 12% compared to last month. You tap into the detail view and spot six customers whose plans lapsed in the last two weeks and haven't rebooked. Three of them are commercial accounts worth $400 each annually.
Then you check tech performance. Your senior tech averaged $510 per call this week. Your newest hire averaged $195. That's not surprising, but the gap is wider than last month. Time to pair them on a few calls.
You glance at after-hours leads. Fourteen came in this week. Eight got a response within two minutes. Six waited until Monday morning. That's $900 to $4,800 in potential revenue sitting in a queue over the weekend.
Monday morning, you walk into the office with a plan. Your team knows exactly who to call about renewals. You've got a coaching conversation lined up for the new hire. And you're rethinking how after-hours leads get handled. None of this required a spreadsheet, a phone call, or logging into three different systems.
Where the data comes from
The dashboard doesn't invent numbers. It connects to what you already use.
Most HVAC companies run some combination of field service software (ServiceTitan, Housecall Pro, Jobber) and accounting software (QuickBooks, Xero). The dashboard pulls from those via APIs and combines the data into views that make sense for your business.
If your field software tracks call type, technician, and revenue, the dashboard can slice that data any way you want. If your CRM tracks maintenance plan status and renewal dates, the dashboard surfaces expiring plans before they lapse.
Setup means mapping your existing data to the dashboard views. No new data entry, no extra forms for your techs to fill out. They keep doing what they're already doing, and the numbers show up on your screen. You can see what other HVAC-specific AI tools look like to get a feel for the range of what's possible.
What this isn't
This isn't ServiceTitan or any other field management tool. Those handle dispatching, invoicing, and customer records. The dashboard sits on top of those tools and answers the question you're asking every week: how is my business doing right now?
It's also not a generic BI tool like Tableau or Power BI. Those are powerful, but they require someone who knows how to build reports and maintain them. An HVAC-specific dashboard comes pre-built around the metrics that matter for your trade. Revenue per tech, maintenance renewals, seasonal trends, after-hours conversion. You open it and the answers are already there.
Seasonal patterns in your own data
HVAC is a feast-or-famine business. Summer and winter bring more calls than you can handle. Spring and fall slow to a crawl. The companies that stay profitable year-round are the ones who see the slowdown coming and act on it.
A dashboard built for HVAC shows you seasonal patterns based on your own history, not generic industry averages. You can see that last October your revenue dropped 30% from September, and it didn't recover until December when the first cold snap hit. Armed with that, you can front-load maintenance plan outreach in September, run a pre-season tune-up promotion, or adjust staffing before the dip hits your payroll.
The national HVAC franchises have business intelligence teams running this analysis for them. A custom dashboard gives your local shop the same visibility without the corporate overhead.
Most HVAC companies don't have this
Most local HVAC companies are running their business from a combination of gut feel, field software reports, and whatever their office manager can piece together by Thursday afternoon.
Very few have a single view that shows revenue, tech performance, and maintenance renewals in one place. Even fewer track after-hours lead response times or know their close rate by service type.
That gap gets wider as the national brands invest more in data and operations. A custom dashboard doesn't just give you better numbers. It lets you make decisions on Monday that your competitors won't figure out until the end of the month.
Not sure where AI fits into your operation? The AI readiness quiz takes two minutes and gives you a starting point.
What it takes to build
A dashboard like this typically takes two to three weeks from kickoff to delivery. The first week is mapping your data sources and confirming what metrics matter most. The second is building the views. The third is testing with real data and making adjustments.
The output is a live dashboard you can access from any device. It updates automatically as new data flows in from your field software and accounting tools. No manual refreshes, no data exports.
You can see the full picture of what we build for HVAC companies on the AI for HVAC page, including automations that pair well with the dashboard, like automated review requests after completed jobs and emergency lead routing after hours.