Building a customer retention dashboard for pest control companies
The first call is never the real money. A homeowner finds ants crawling across the kitchen counter, panics, and searches "pest control near me." You show up, spray, charge $150, and the ants are gone by Tuesday. Job done.
But that $150 job cost you $60 in marketing to acquire. The real money is converting that panicked first call into an annual prevention plan worth $400 to $600 per year, every year, with almost zero acquisition cost after the first visit. That recurring revenue is what separates pest control companies that grow from ones that stay on the treadmill.
The problem is tracking it. Most pest control companies with 2 to 20 employees are running their renewal process off memory, a spreadsheet, or maybe a field in their CRM they don't check often enough. Customers churn quietly. You don't notice someone dropped off their quarterly plan until months later, after they've already called a competitor.
And that's the part that stings. You have no idea which of your 200 active accounts are about to cancel versus which ones are locked in for another five years. The information exists in your system somewhere, but nobody's looking at it in a way that surfaces the problem before it becomes a lost customer.
An AI customer retention dashboard changes that. It puts every recurring customer's health, renewal timing, and lifetime value on one screen and tells you where to focus before you lose someone.
What the dashboard would track
The retention dashboard we'd build for a pest control company is a single view of your recurring customer base. Not your full customer list. Just the people who've signed up for a quarterly, bi-monthly, or annual plan and are generating recurring revenue.
Every customer card shows the basics: name, address, plan type, how long they've been with you, and their lifetime value to date. A customer on a $480 annual plan who's been with you for three years has a lifetime value of $1,440. That number matters because it tells you how much you'd lose if they cancelled.
The dashboard groups customers by health status. Green means they're current on their plan, had a recent service visit, and their renewal isn't coming up for a while. Yellow means their renewal is approaching in the next 30 to 60 days or their last service visit was more than 90 days ago. Red means they're overdue for renewal, missed a scheduled treatment, or have been flagged for cancellation risk.
The churn risk scoring is mostly common sense turned into math. Has the customer called to complain recently? Did they skip their last scheduled treatment? Have they gone more than 90 days without any interaction? Did they decline an upsell they'd accepted before? Each of these bumps up the risk score. None of them would surprise you if you thought about it. But you're not going to sit down and mentally run through 250 customers asking those questions.
At the top of the dashboard, you'd see the numbers that matter most for a pest control business running a recurring model: total active plans, monthly recurring revenue, renewal rate over the last 90 days, average customer lifetime value by service type, and a churn count showing how many customers you've lost this month versus last.
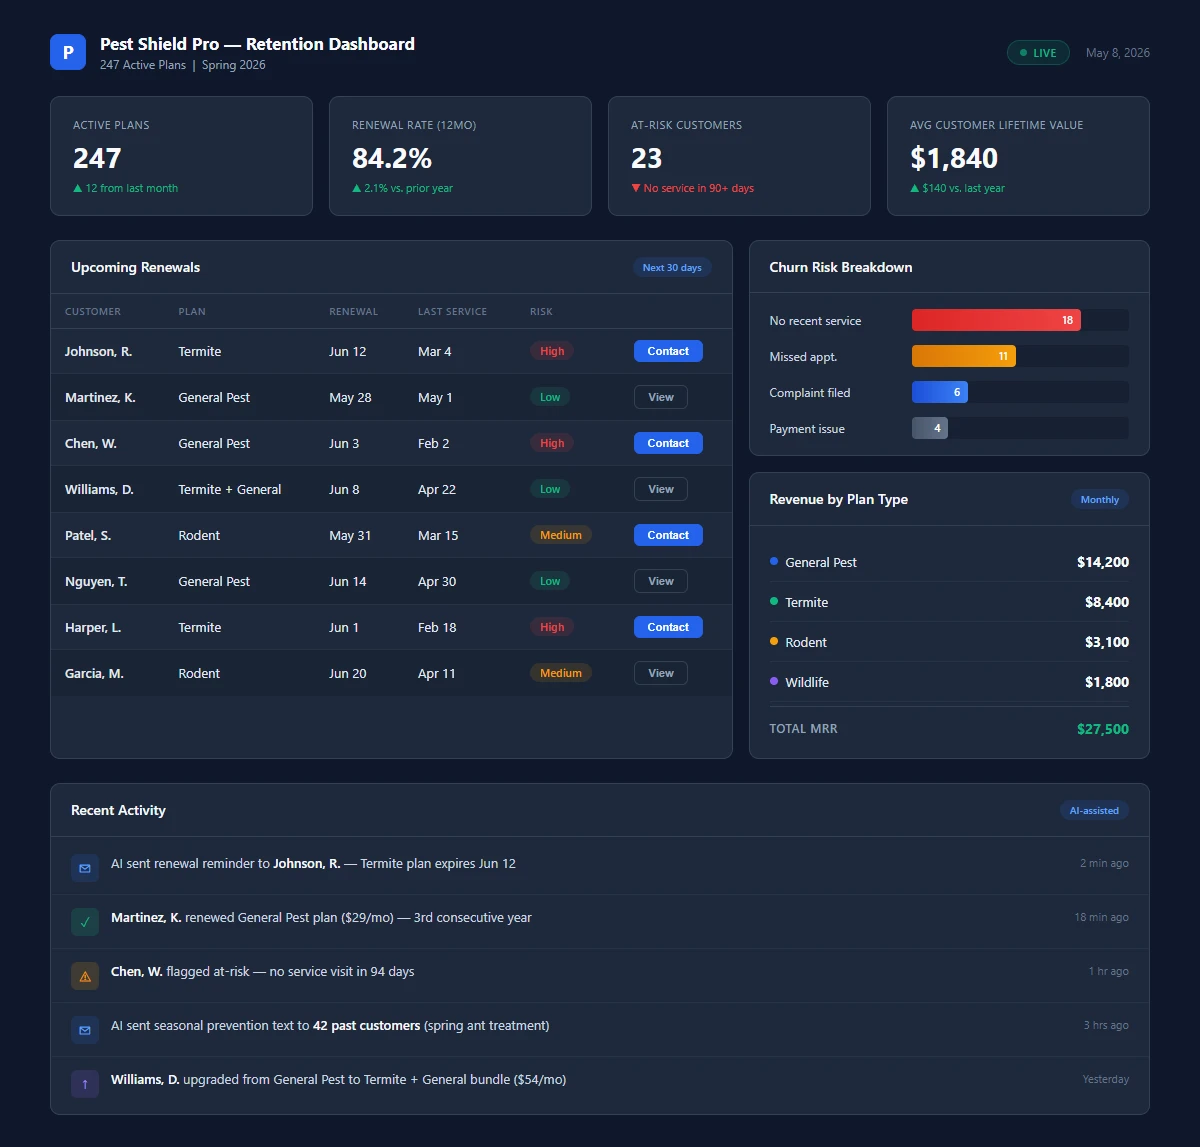
Customer retention dashboard tracking recurring plan health, renewal timing, and churn risk for a pest control company with 200+ active accounts. Download as PDF
View interactive version
Friday morning with the dashboard open
You check the retention dashboard on a Friday and see that 23 annual plan customers are coming up for renewal next month. The system has already scored each one. Fifteen of them are green, meaning they had a service visit in the last 60 days, no complaints, no missed treatments. Those renewals will probably happen automatically.
Eight of them are yellow or red. They haven't had a service visit in over 90 days. One of them called about a billing question three weeks ago and never got a callback. Another skipped their last scheduled quarterly treatment and didn't reschedule.
If you don't catch those eight, their renewals go out as invoices. The customer opens the bill, thinks "I haven't seen the pest control guy in months," and cancels. Eight customers at $480 each. That's $3,840 in recurring revenue gone because nobody looked.
But you did look, because the dashboard put it in front of you. So your office manager calls each of those eight before the renewal notice goes out. "Hey, it's been a while since your last treatment. We'd like to get you scheduled this week before spring bug season kicks in, and your renewal is coming up next month so this visit is already covered."
Three minutes per call. The customer remembers why they're paying you. They feel the value before they see the invoice. Maybe six of the eight renew instead of two. Four saved customers, $1,920 in annual revenue, 24 minutes of phone time.
Lifetime value by service type
One of the more useful views on the dashboard breaks down customer lifetime value by what service brought them in. This data changes how you think about your marketing spend.
Customers who started with general pest control (the "I found ants" call) might have an average lifetime value of $1,200 over three years. They signed up for a quarterly plan, kept it going, and that was that.
Customers who started with termite treatment tend to have higher lifetime values, often $2,400 or more, because termite protection requires ongoing monitoring and the annual renewal rate is higher. Nobody cancels their termite plan and hopes for the best.
Bed bug customers might have the lowest retention. The problem is acute, they want it solved, and once it's solved they rarely convert to a recurring plan. Their average lifetime value might be a single $800 treatment.
These numbers tell you where to point your advertising. If termite customers are worth twice as much over their lifetime as general pest customers, maybe that Google Ads campaign targeting "termite inspection near me" deserves a bigger budget than the generic "pest control" one, even if the cost per click is higher. The math works differently when you know the long tail.
Seasonal re-engagement
Pest control is a seasonal business. Spring and summer are when bugs show up and homeowners pick up the phone. Winter is when customers forget you exist and wonder why they're paying for a plan.
The retention dashboard connects to a seasonal re-engagement system that runs automatically when spring arrives. Past customers who aren't on an active plan get a personalized text based on their treatment history.
The homeowner who had carpenter ants last March gets: "Spring is peak ant season again. Want us to do a preventive treatment before they show up? We can get you on the schedule this week." The family who had a rodent control issue the previous fall gets a different message about pre-season inspection.
These aren't generic blasts. Each message references what actually happened at that customer's property and when. A five-person pest control company would do this naturally if the owner could remember every customer. The system just scales that memory to 340 people without anyone on your staff pulling names from a spreadsheet.
The numbers on this type of automated outreach are worth looking at. When a pest control company sends personalized, history-based texts to past customers in early spring, booking rates in the first week typically run around 10 to 15 percent. For a list of 340 past customers, that's 34 to 50 bookings before spending a dollar on advertising. At $150 average ticket for a one-time treatment, that's $5,100 to $7,500 from a single campaign you didn't have to think about.
Some percentage of those one-time bookings will convert to recurring plans too, which starts the whole cycle over again with zero acquisition cost.
How it connects to your current setup
If you're using PestRoutes, FieldRoutes, or PestPac, the retention dashboard integrates with your existing customer and scheduling data. Service history, billing records, and plan details sync over. When the dashboard flags a customer for outreach, your team can pull up their full history in the same system they're already using.
If you're running a smaller operation with QuickBooks and a route sheet, the dashboard works as a standalone tool. Customer data gets imported once, and then service visits and renewals are tracked through the dashboard itself.
The dashboard doesn't replace your existing workflow. It adds a layer on top that answers questions your current tools don't: Which customers are at risk? Which plan types retain the best? Where should you spend your outreach time this week?
Your daily routine doesn't change much. Techs still run their routes. Your office still handles scheduling. You just add a 10-minute check each Friday where you look at the retention board, spot the at-risk accounts, and make a few calls before those accounts turn into cancellations.
Why retention beats acquisition
Most pest control companies pour their marketing budget into acquiring new customers. Google Ads, Angi leads, door hangers, yard signs. That spending is necessary. But the math on retention is lopsided in your favor.
A new customer costs $40 to $80 to acquire, depending on the channel. Keeping an existing customer on a recurring plan costs almost nothing. A text, a phone call, maybe a service visit that was already included in their plan anyway. And the retained customer is easier to upsell because they already know your techs by name.
A pest control company with 200 recurring customers and a 90% annual retention rate keeps 180 and loses 20. That same company with an 80% retention rate keeps 160 and loses 40. The difference between 90% and 80% retention is 20 customers, which at $480 per annual plan is $9,600 in recurring revenue. Every year.
Over five years, that 10-point improvement in retention compounds to roughly $48,000 in revenue you kept versus revenue you'd have had to replace through new customer acquisition.
The retention dashboard doesn't need to perform miracles. Moving your retention rate up five or six points pays for itself because the money is already recurring. You're not closing new deals. You're keeping revenue that was already yours.
The gap national chains leave open
National pest control chains like Terminix and Orkin spend millions on brand advertising. They have name recognition that a local company with 10 employees can't match with a billboard budget.
What they don't have is a relationship with any individual customer. A Terminix customer gets the same renewal letter as every other customer in their region. Nobody texts them in March about the specific ant problem they had last April. Nobody calls when their renewal is approaching and their last service visit was three months ago.
When you had 40 customers, the owner knew every one of them. That was a real competitive advantage. Once you pass 100 or 150 recurring accounts, that personal knowledge falls apart unless you build a system to hold it.
The retention dashboard gives a 200-account local pest control company the same data visibility as a national chain, but you keep the personal follow-up that customers chose a local company for in the first place. Terminix runs one playbook for 10,000 customers. You run a specific playbook for each of your 200.
The company that knows when a customer is about to churn and acts before the renewal invoice hits will keep more customers than the company that sends invoices and hopes for the best. That's just arithmetic.
Getting started
This is one of the simpler custom AI tools we'd build because it works with data you already have. Customer records, service history, plan types, billing dates. It's all sitting in your existing software. The dashboard just pulls it into a single view organized around one question: who's about to cancel?
Setup runs two to three weeks. Import your data, configure the churn risk scoring to match your specific service patterns, and you're looking at a working dashboard. The seasonal re-engagement layer gets added after the base is running, usually the month before spring so it's ready when you need it.
We build this for pest control companies. If you want to see what it'd look like for your customer base, start here.
Meta description: AI customer retention dashboard for pest control companies tracks recurring plan renewals, churn risk scores, and lifetime value by service type. See what we'd build. Word count: ~2,100 Primary keyword: AI customer retention pest control Notes: None
Internal links used
| Link | Anchor text | Section |
|---|---|---|
| https://crave-media.ai/ai-for/pest-control/ | pest control business | What the dashboard would track |
| https://crave-media.ai/services/ai-tools | rodent control | Seasonal re-engagement |
| https://crave-media.ai/blog/automated-review-requests-carpet-cleaning | automated outreach | Seasonal re-engagement |
| https://crave-media.ai/blog/workflows-service-business-automate | workflow | How it connects to your current setup |
| https://crave-media.ai/services/ai-tools | custom AI tools | Getting started |
| https://crave-media.ai/ai-for/pest-control/ | that's exactly what we build | Getting started |